


Our Case Studies
Project Name: Real Estate Dashboard Module
Client
Client has nation wide operations in the business of Titles and Escrow activities of Real Estate Industry. The client has large collection of data, which they needed to be presented, charted and graphed in a synchronized manner so that the business users can comprehend the business activities going on in the organization. They should be able to understand the trends of the past and anticipate the trends to take appropriate business decisions. The data and information was needed to be presented both based on geography as well as on the basis of organizational structure.Why STPL?
STPL has had experience of working on software applications in the business of real estate. The technical team deployed was already familiar with the language of the business and client got the head start in interacting with the team and communicating the needs. Client was also looking for an IT services organization with ability to plan-build-manage the solution. STPL fit in the role and provided services for all the three phases of the application life cycle.Benefits
- Good Customer Experience
- Faster Quality Productivity
- Property management
- Reduce Overheads for the buying and selling of the property.
Project Overview
The prime business need was to manage the massive databases located in different regions and present the information from the centralized data storage, the application provides performance graphs over a span of time, projected values on the basis of different levels (national, region, state, county, territory) etc.The management needed an application that could provide better view of their transactions, revenues generated and the projected values.
As the data base is distributed over various data storages, the need for an application that would synchronize and manage the data was an essential requirement.
Application is structured as follows:
- Summary Module
- Order Module
- Revenue Module
- Multi Dimension Reports
- Popup Graph Description Module
2. Region Dashboard
- Summary Page
- Productivity Page
- Search Page
- NEWS Page
- FSA Rules Page
- Campaign Module
- Productivity Page
- Sales Person Module
- Popup Graph Description Module
- Builder Module
- Revenue Wizard (356.aspx Page)
3. Admin
- Hook up Tool
- Canonical Tool Agent
- Canonical Tool Company
- Team Plan
- Security Management
4. Project Documentation
- Application Architecture Document
- Database Elaboration Document
- Lineage Document
- User Interface Document
- Setup and Deployment Document
5. Miscellaneous Functionality
- Sql Server Reporting Service
- AJAX Implementation
- Lineage Document
- Business Intelligence Services
- Data Warehousing
- Dundas Components
National Dashboard:
As the business of the client is distributed all across USA, the client required that the application should help the management to drill down to the transaction level.
The data was also to be presented in such a manner so that analyzing performance at lower level is easier.
Information was to be used for decision making hence the accuracy of information being reported is critical.
Technically the application had to be architected as follows:
- Application designed based on N-Tier architecture
- Graphical presentation of reports using SQL Server Reporting Services
- Data migration technique using SQL Server Services were used.
- Performance and Security Issues were to be balanced.
- Easy to navigate through the site and see the performance at the different levels.
- Data Synchronization across distributed data bases
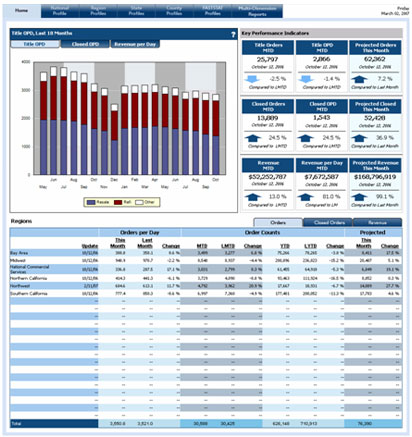
Summary Module
This module represents information in the mode of KPI (Key Performance Indicator). STPL analyzed the Real Estate business and proposed the few key factors that helped in taking quick decisions.
The summary module page contains information for orders, revenue. The module represent comparison between different time period, status in current time frame, projected information for order or revenue against different levels like national, region, state, county, territory and thus multi dimension report were created.
Order Module
This is the one of the major part of the National Dashboard application. The order module divided in different sub-groups like open orders, closed orders, open vs. closed orders, last year vs. this year.
To present comparative/ projected information, application is using graphs
Revenue Module
The revenue module covers the sub-groups like revenue trends, last year vs. this year. The pages represent the data in the mode of graphs and tables.
Having the KPIs in sub-groups helped the user to quickly see the important data. The flag feature is incorporated in the KPIs. It helps user to easily visualize the comparison against last month, last year even for last working day.
Multiple Dimension Reports
The MDR has its own way of representing data. The information is presented in the tabular format. The multiple dimension reports are divided two major sections "Order", "Revenue". The reports are available at different level like territory, county and regions.
Pop-up Graph Description Module
The application has number of graphs to display information. The main objective was to create this graph to have better presentation (bigger size of graph) and provide more information (Tabular, Description of graph). On the top every graph has a question mark; once user clicks that question mark, new pop-up window opens with additional information.
Region Dashboard:
The application is similar to National Dashboard. This application has more features in respect of national level. Some of the features like search, news, multiple dimension reports, daily, weekly, monthly reports.
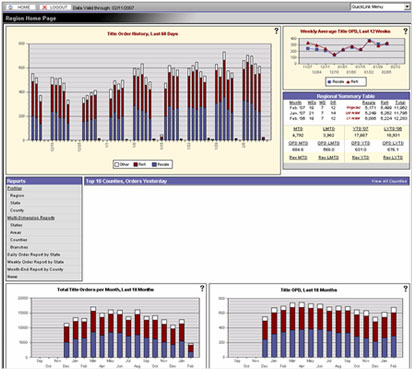
Summary Page
This module represents KPI (Key Performance Indicator).
The summary module page contains information for orders, revenue. The module represent comparison between different time period, status in current time frame, projected information for order or revenue against different level like national, region, state, county, territory, multi dimension report.
Productivity Page
The page shows information surrounding the employee like order, revenue. KPIs are the one of the part of this page. Through this page only user can know the number of employees hired/ fired in current month. Total number of orders newly created/ closed. Most of the information presents in graphical way. User can edit the profile of any employee.
Search Page
The page provides the site search functionality. The filtration criteria are city, county, contacts, file number, company, property address, and employee. The page displays the employees, agents, companies based on the criteria chosen.
News Page
The page provides the WWW search functionality. This page has different real estate companies and returns latest news against the selected company by the user.
FSA Rules Page
This is the static page and describes the FSA Rules.
Campaign Module
This module is made for Agents. Taking advantage of this module agent can create, edit the campaign.
Sales Person Module
The module is created for sales representative/ manager. The different roles are assigned to sales people. When they logged in control goes directly sales person module.
Popup Graph Description Module
The application has number of graphs to display information. The main objective was to create this graph to have better presentation (bigger size of graph) and provide more information (Tabular, Description of graph).
On the top every graph has a question mark; once user clicks that question mark, new pop-up window opens with additional information.
Builder Module
The module has four major sections like Agent, Builder, Real Estate Broker and SubDivision.
Almost every place user can see the reports, Builder Module is the functional area there user can create/ Edit functionality against each sub modules.
Agent Section
In this section user can create, edit agent. The section provides functionality to manage agent personal information and other tabs like
- Associate company with agent
- Associate subdivisions with agent
- Associate sales rep/ team/ escrow closers with agent
- Associate preferred closer with agent
- Associate employer company with agent
- Associate campaign
Builder Section
In this section user can create, edit Builder Company. The section provides functionality to manage basic information of company also following functionalities incorporated:
- Associate employees with builder company
- Associate subdivisions with builder company
- Associate sales rep/ team/ escrow closers with builder company
Real Estate Broker Section
In this section user can create, edit Real Estate Broker Company. The section provides functionality to manage basic information of company also following functionalities incorporated:
- Associate agent Roster with Real Estate Broker company
- Associate sales rep/ team/ escrow closer with Real Estate Broker Company.
Sub-division Section
In this section user can create, edit sub-division. The section provides functionality to manage agent personal information and other tabs like
- Associate company with sub-division
- Associate agent with sub-division
Admin
Two dashboard applications at national and region level are created; and application is used to present the information to user based on their access permission. The dashboard applications are created to display the information, now question was how to manage the information/ data.
STPL analyzed the needs of client and proposed the admin application that control relevant data. Following sections are proposed for admin application.
- Hook up Tool
- Canonical Tool Agent
- Canonical Tool Company
- Team Plan
- Security Management
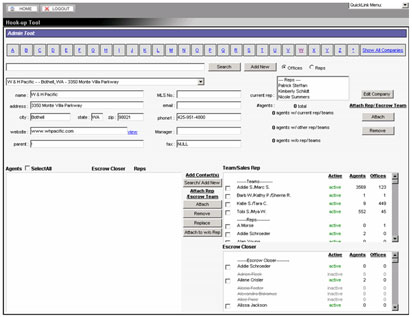
Hook up Tool
The admin user can access this tool, it has the futures to create a company, add agent, associate agent with sales team/ rep or escrow closer.
This tool is similar to builder module created for normal users in the region dashboard application. Database for the region decide when the user logged in.
Canonical Tool Agent
The main objective of the application is to remove the repeated entries and build the set of similar records. Currently we are using this too in the Real Estate Industries; but this tool will be helpful in the other industries where the same entity repeats number of time in different time span. And management wants to know the unique entity. The canonical tool is used to synchronize the data based on the similarity and other business logics. It creates fresh set of records.
This tool is used for the Agent participate in the Real Estate Industries.
Canonical Tool Company
The main objective of the application is to remove the repeated companies and build the set of similar companies depending on different criteria chosen. It is very helpful tool where chances of same entity repeats number of time in different time span like (hotel). Management likes to get the information of similar type of companies based on the different parameters and the records should not be repeated. The canonical tool is used to synchronize the data based on the similarity and other business logics. It creates fresh set of records.
This tool is used for the Company participate in the Real Estate Industries.
Security Management
The page is responsible to set the access permission to each user against the page available in the region dashboard and national dashboard. This is most powerful tool of the application.
Through this tool STPL tried to implement the security feature. Security is not limited to page only. This is implemented even at the section level.
Project Documentation:
The STPL used to create the necessary document for each project, few of them mentioned here,
a. Introduction
b. User Cases
c. Logical View
d. Class Diagram and Description
e. Description of Third Party Tools/
2. Database Elaboration Document
a. Introduction
b. Data Model Diagram
c. Data Model Description
d. Stored Procedure Descriptions
e. User Defined Function Descriptions
f. Data Migration Strategy (Optional)
3. User Interface Document
a. Introduction
b. Screen Layouts and Extensions
c. Description of Business Rules
d. Sequence Diagram
4. Setup and Deployment Document
a. Introduction
b. Minimum Hardware and Software Requirements
c. Setup and Deployment Process
5. Lineage Document
a. Introduction
b. Page Description
c. Screen Layout
d. Page Elements (Table, Graphs, Info Box and KPIs etc).
Challenges
The development of application was to take place in a distributed manner across two time zones. The development took place on both sides of the globe and had to be controlled and managed. Following were some of the challenges:- Project Management
- Meeting short dead lines
- Migrating to latest technologies
- Maintenance of huge database
- Version maintenance
- Development was taking place on onsite as well as offshore
- Unclear and ambiguous requirements
Solution
The team at STPL analyzed the needs and gave the solutions for them. Two Dashboard applications were developed to show the information in a presentable manner at different levels and modes.Since the Client required the flexibility to the information being presented, STPL to build Admin module which helped the management to manage the data shown in two Dashboard applications.
Technology Used
- S-Project
- Visual Studio .NET 1.1/ 2.0
- ASP.NET
- C#
- AJAX
- XML
- Atals Control
- Dundas
- SKM Data Grid
- IIS 5.0/ 6.0
- Scripting Languages (JavaScript, VB Script)
- SQL Server 2005 Database
- SQL Server 2005 Reporting Services
- SQL Server 2005 Intelligent Services
- Visual Source Safe
- Ms-Office (Visio, Word, Snagit 8.x, WinMerge etc)
Background
SQL Server 2005 Reporting Services is a key component of SQL Server 2005. Reporting Services was first released with SQL Server 2000 and provided customers with an enterprise-capable reporting platform with a comprehensive environment for authoring, managing, and delivering reports to the entire organization. Reporting Services in SQL Server 2005 provides additional enterprise reporting capabilities and addresses a new audience-business users who want to interact with data in an ad hoc fashion as well as create their own reports from scratch and to share them with others. In Reporting Services, the requirements of different types of users who want to interact with reports can, for the first time, be addressed with one reporting solution.
Benefits
Microsoft SQL Server 2005 Reporting Services is an open and extensible solution for managed reporting. The flexible architecture enables software developers and enterprises alike to integrate Reporting Services with legacy systems, enterprise portals, or custom applications. For example, developers can use the open interfaces and extensibility to:
- Create applications that generate reports using the Report Definition Language (RDL).
- Create applications that embed or link to a Web browser to present and manipulate report output through URLs.
- Create applications to manage one or more report servers through the Web services interface.
- Create additional rendering, delivery, and data processing extensions using the Microsoft .NET Framework.
The functionality in Reporting Services enables developers to focus on
providing business value rather than building generic reporting
infrastructure in their applications. SSRS 2005 provides an option in
setup to install but not configure the report server. It also provides
the Reporting Services Configuration tool that lets you create a
virtual directory on any Web site.
AJAX Implementation
Background
AJAX stands for Asynchronous JavaScript and XML. AJAX is a type of
programming made popular in 2005 by Google (with Google Suggest). AJAX
is not a new programming language, but a new way to use existing
standards. AJAX is about better Internet Applications. Web applications
have many benefits over desktop applications; they can reach a larger
audience, they are easier to install and support, and easier to
develop. However, Internet applications are not always as "rich" and
user-friendly as traditional desktop applications. With AJAX, Internet
applications can be made richer and more user-friendly.
Benefits
With AJAX you can create better, faster, and more user-friendly web
applications. AJAX is based on JavaScript and HTTP requests. With the
use of AJAX, the client side script can trade data with a web server,
without reloading the page, increasing the performance of the
application. The AJAX technique makes Internet applications smaller,
faster and more user-friendly.
Business Intelligence Services
Background
SQL Server 2005 provides many new and enhanced business intelligence
(BI) features designed to give you a competitive advantage. Review the
following technical resources and other information designed to help
you improve BI in your organization.
Integrate: Easily integrate data from a wide range of operational and
enterprise data sources, and gain competitive advantage through a
holistic view of your business.
Analyze: Gain an integrated view of all your business data as the
foundation for your traditional reporting, OLAP analysis, scorecards,
and data mining.
Report: Deliver the information employees need to make better business
decisions-in virtually any business environment.
Data Mining:Explore data, discover patterns, and apply these patterns
to business operations with an easy-to-use, extensible, accessible, and
flexible platform.
Benefits
The advantages include integrating multiple data sources with Integration Services; enriching data and building complex business analytics with Analysis Services; and writing, managing, and delivering rich reports with Reporting Services.
Data Warehousing
Background
Since the early days of computers, getting information from data is most vital aspect of using computer systems. As time went on the data used for extracting information grew exponentially. With the data increasing the need for data management came up as well. And this gave way to the most revolutionary development which is today known as Data Warehousing.
Data warehousing is process by which we extract information from historical data. This information is very important in the aspect as it helps the management in quick decision making.
Benefits
The crux of benefit of using data warehousing methodology is that we extract information from large data sources that contain historical data. This information helps the management in quick decision making.
Dundas Components
Background
Sql Server Reporting Services came as remedy for the need of presenting the data in a presentable manner as Charts. But the charts in embedded in the Reporting Services failed to full fill all the demands of the industry. As a solution for this problem Dundas Component came in the picture. The Dundas component proved to be very helpful. It increased the visualization of the charts and added few more chart options which were lacking in the Sql Server Reporting Services.
Benefits
Dundas component gave an edge to the visualization of the charts. It added new features to the Reporting Services which proved to be very helpful in the presentation of the charts.